We have come a long way. The original group trading strategy anticipated the need to resort to a complicated money management strategy. A simple range trading strategy emerged that made complicating steps unnecessary.
Testing from 2011 showed the best chance of earning a profit came from the following settings on the EURUSD:
- 30 minute chart
- Price exceeds 1.5% or more of the 200 SMA
- Buy/sell at market on an expectation of reverting to the SMA
The tests showed a hypothetical net profit of $1,310 trading 1 standard lot per signal. Assuming that you're comfortable using 10:1 leverage, that makes for an annual return of 13.1%. Higher leverage increases the return at increased risk. Lower leverage decreases the return at decreased risk.
Walk forward results
The walk forward results are profitable! That is a huge relief, especially given the amount of effort put into the research.
The thing that disappointed me the most, however, is the huge drop in the number of trades. The original strategy placed 60 trades in a 12 month period. The walk forward test only traded 22 times.
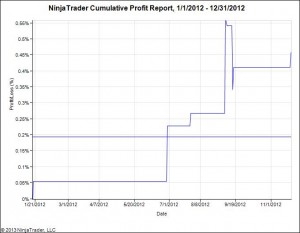
The equity curve shows a substantial time lag in between trades. The blind test shows a profit.
The equity curve makes it obvious that nothing happens for large periods of time. Over six months pass between the first trade on January 19, 2012, and the next trade on June 29.
Thereafter, the pace really picks up. September 2012 showed the most activity with 12 total trades - more than half of the year's activity happened in that individual month.
The gross outcome is a profit of $580. The cost of trading, assuming a 2 pip spread, is $440. The final return is $140, or a 1.4% return on 10:1 leverage.
Metrics
The results for the walk forward tests, as shown in NinjaTrader
Trading efficiencies of the 2012 walk forward results
|
The entry efficiency |
The exit efficiency |
Analysis
The substantial drop in the number of trades relates to something that we already knew. The trading strategy needs volatility in order to find trading opportunities.
Whenever volatility drops, which forex brokers bemoaned at the Forex Magnates conference in London, the number of trading opportunities drops, too.
The walk forward test indicates that this is a great strategy to keep in my pocket for when volatility picks up later this year. It held up on blind data. Although the higher profit facotr likely results from the small sample size, it feels reassuring when the metrics improve on the blind data.
I allowed myself to cheat slightly where I tested the 1% setting in 2012 instead of the 1.5%. The performance showed a similar drop in the number of trades and in the profit. Importantly, however, the numbers in that sample set improved.
I like this strategy because it is stable. Changing the setting from 1.3% to 1.5% does not cause a drastic U-turn in the performance. In other words, it's steady and predictable.
I would feel far less confident in the outcomes if minor changes in the settings yielded enormously different profits or losses. Violent shifts in outcomes from small changes relate to chaos theory. That's not a desirable trait in an algorithmic system.
Future improvements to the strategy might relate volatility to the entry setting. When volatility is low, the 1.5% threshold might lower to 1%. As volatility rises, a band of 2% might yield better outcomes in extreme scenarios. An obvious next step would be to relate the movement of the band to the volatility of the EURUSD itself.
After-thoughts
This series eventually led to a profitable trading strategy. If you'd like to read through the journey, then I suggest reading the articles sequentially
The initial strategy idea
Selecting an appropriate time frame
A research plan
An annoying surprise in the initial backtests
An attempt at range trading
Range trading results
The moving average envelope scalper
The post Ranging SMA 200 Walk Forward Results appeared first on Algorithmic and Mechanical Forex Strategies | OneStepRemoved.
